
Three months of action came to a close two weeks ago as Team oNe was crowned the Six Mexico Major champion to end Stage 2 of the 2021 Season. Now, as Stage 3 approaches, let's take a dive into the map pool to see how every map and objective played out in each region.
Note: Stats were collated before the Polish Nationals Finals or the GSA League 2021 Finals began.
Jump to:
Tier-One Stats
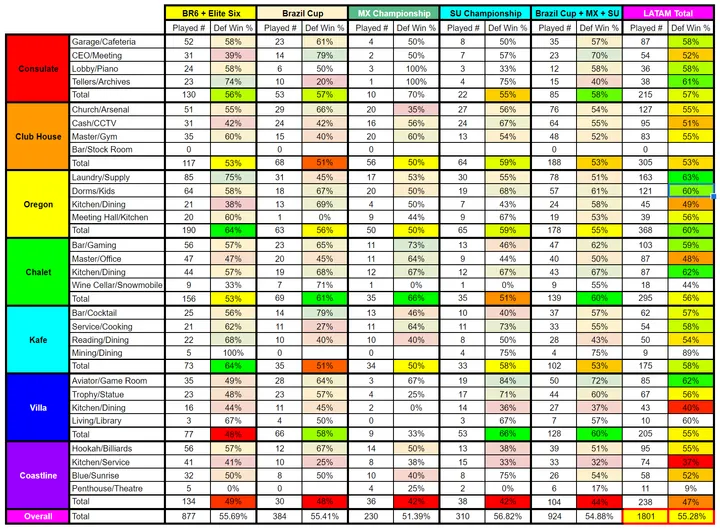
As seen below, the full stats of all the pro-tier leagues had the defenders winning 54.39 percent of all rounds across the more than 3,000 rounds played. This varied slightly between regions, as APAC and LATAM were effectively even, Europe was two percentage points more defender-sided than them, and North America was three percentage points more attacker-sided.
Fairly interesting, however, was that the round stats from the Six Mexico Major came out almost completely balanced, with 51.19 percent of rounds being won by the defense.
Maps-wise, every single map except for Oregon had each half end with an average scoreline of 3-3, while Oregon's 65 percent defensive win rate meant a 4-2 lead was the norm. This fact includes Villa, where the defensive domination has officially ended and it was the third most attack-sided map in Stage 2 (just behind Chalet and Coastline at 54 percent).
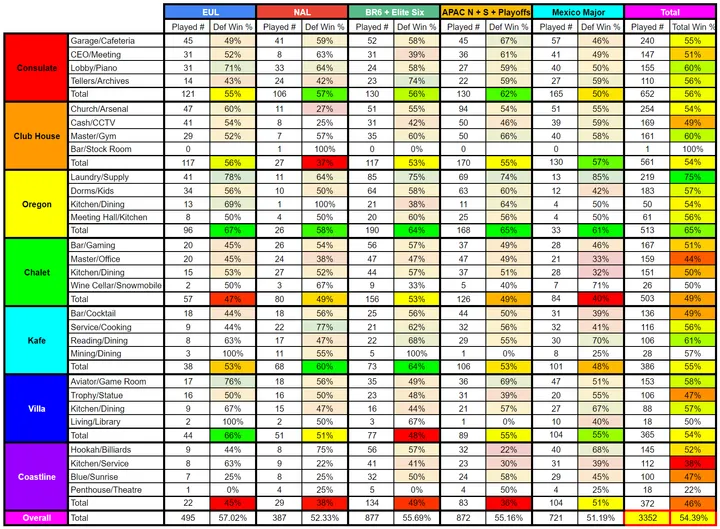
The full map stats for Stage 2 as also seen in the map infographic. Can be seen in full resolution here. All the above numbers were collected from the public SiegeGG Competition Pages for Stage 2 which can be accessed here.
Find the full stats for the tier-two leagues for each region further down the article, here.
Here's a deeper breakdown of all the biggest things of note from the numbers above:
Consulate's changing site order
Consulate ended the stage as the most played map, in large part because it was the most-picked map at the Six Mexico Major. While the sites were all fairly even at the Major, there were a number of odd stats in the individual regions.
North America was unique in avoiding the CEO/Meeting objective. While it is traditionally the second site defended, it had a mere seven per cent pick rate, with the Tellers/Archives objective being picked instead.
Over in LATAM, this objective remained the second-most played, but it only held a 39 percent defensive win rate compared to 74 percent for Tellers/Archives.
These changes thus resulted in Lobby/Piano becoming the overall second-most picked site globally, with Consulate finally getting more interesting just before its removal from the map pool for Stage 3.
Clubhouse (N)ot (A)geless in Stage 2
Overall Clubhouse was the second-most played map, but was number one in APAC. However, in the NA League, it had just a seven percent pick rate after featuring in just two matches: DZ vs OxG (8-7) and Mirage vs OxG (7-5).
While this is a very small sample size, these 27 rounds totalled a 37 percent defensive win rate on the map; very close to being the lowest we've seen in any region.
These 10 defensive round wins included the only pick of the Bar/Stock objective -- the least popular site across all seven maps -- which was won by Oxygen following a retake and defuse.
A messy party on the Coastline
Coastline was the least picked map in both EU and APAC, and was by far the most attack sided map in the pool. It stood out most of all due to how inconsistent the stats were for each site in each region.
Most of note was the Kitchen/Service objective, which was statistically the worst site out of all seven maps (discounting sites like Bar/Stock on Clubhouse). However, this swung from a 22 percent defensive win rate in the NAL to 63 percent in the EUL due to the low sample size, before averaging out at 38 percent across the stage.
Similarly, the main Hookah/Billiards bomb site swung from a 22 percent defensive win rate in APAC to a 68 percent at the Major, to average out at a fairly even 52 percent overall.
Oregon is the new Villa
Finally, we have Oregon which had a 65 percent overall defensive win rate, thanks to a massive 75 percent defensive win rate on the downstairs Laundry/Supply objective. This means that on average across the four regions, halves ended at 4-2 to the defenders, making this the only map in the pool truly slanted to the defense.
This title used to belong to Villa, which has been known as a defensive haven since it was introduced to the map pool. Before Stage 2, 4-2 or even 5-1 defensive halves had been common on the Italian map.
With Villa having had just a 54 percent defensive win rate in Stage 2, it came very much in line with its counterparts and was even one of the more attacker-friendly maps. This was even more evident in LATAM, where Villa is now the most attack sided map in the pool.
On the other hand, nothing changed in Europe, where it remained at a 66 percent defensive win rate, or a 4-2 defensive half.
Comparing to Tier-Two
While these stats were focused at the top tier in each region, it is also worth considering if these key takeaways also transferred to the whole region or were just confined to the top league.
So, for example: did the whole of NA avoid Clubhouse, or just the NA League?
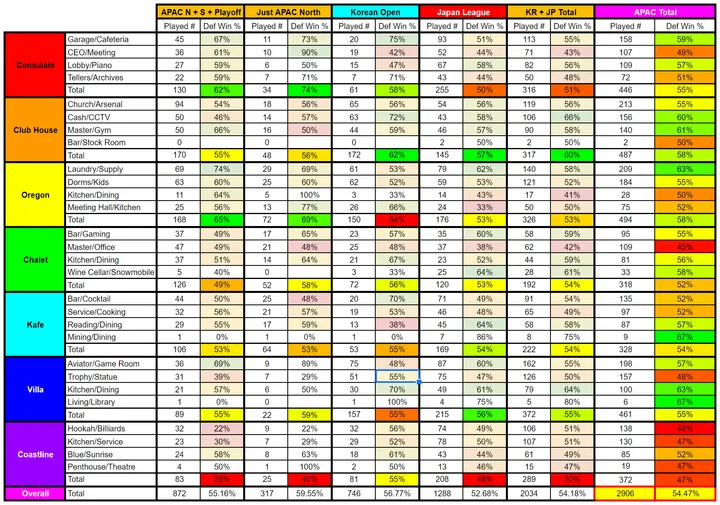
To answer this question, we compared the stats above with the various tier-two leagues that SiegeGG has tracked throughout Stage 2 -- the Korean Open and Japan League in APAC, the Challenger League in NA, the Brazil Cup, Mexican and South American Championships in LATAM, and the French, Benelux, Italian, GSA, and Polish Nationals in Europe.
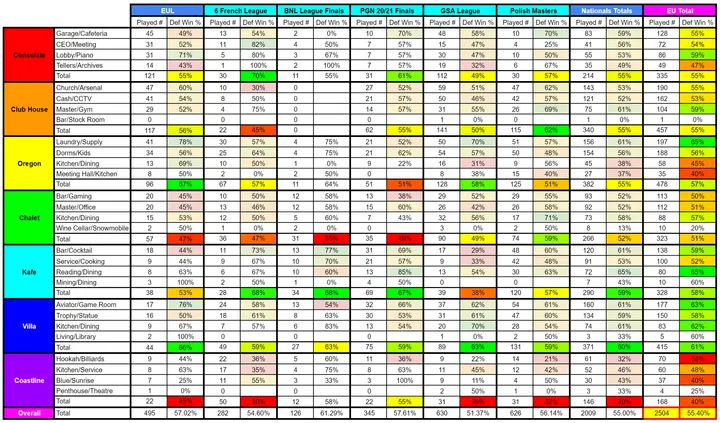
Europe
Across Europe, it is remarkable how consistently attacker-sided Coastline was, with it having a mere 40 percent defensive win rate on average, going as low as 29 percent in the GSA League.
Chalet was the next attacker-sided map, but though both the GSA and 6FL tournaments remain attacker sided like the EUL, a stronger defensive advantage in the Benelux League and Polish Masters it had a 51 percent overall defensive win rate on average.
Elsewhere, while the EUL had a 67 percent defensive win rate on Oregon, the national leagues have it down to a much more expected 55 percent while all of Europe still has Villa in the 60 percent range.
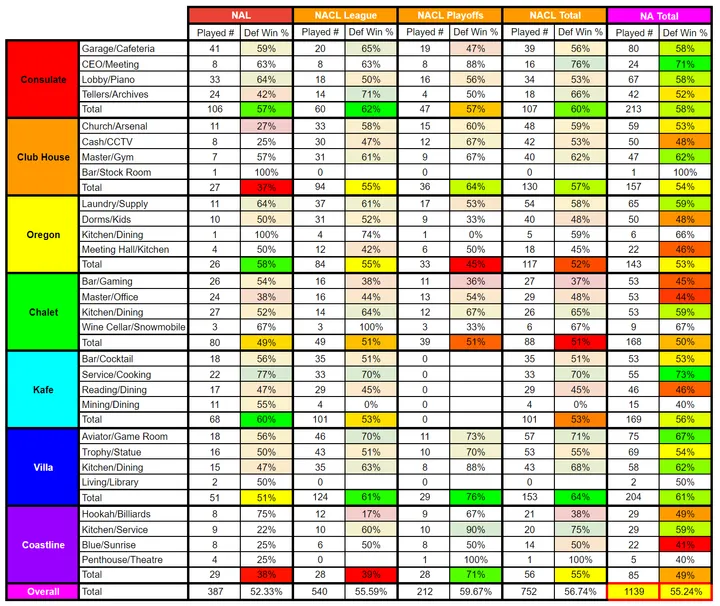
North America
Over in North America, the only Tier-Two comparisons drawn had been with the Challenger League.
Here, the NAL matched well with the group stage of the NACL tournaments on Consulate, Oregon, Chalet, and Coastline. However, the NAL's disdain for Clubhouse did not carry over. In fact, Clubhouse was the NACL's second most played map, behind just Villa.
Finally, just like in Europe, the tier-two leagues still clocked in Villa's defensive win rate in the 60 percent range.
Latin America
Over in LATAM, the Brazil Cup and the top-level Mexican and South American Leagues were factored in, which once again saw Coastline also remain attack-favored, as it had in the BR6 League.
Meanwhile, Villa was hardly picked at all in Mexico, but reached a 66% defense win rate in South America. This raised the overall rate from 48% in the tier-one leagues to 55% across all of LATAM.
On Oregon, meanwhile, the extremely defense favored Laundry/Supply objective in the tier-one leagues was somewhat even. In Mexico, South America, and the Brazil Cup, the Dorms/Kids site was nigh=impenetrable across these leagues with a 61 percent defensive win rate.
Asia-Pacific
Over in APAC, while the tier-two Japan League and Korean Open tournaments were distant in win-rate compared to APAC North and South, both of those nationals were remarkably similar in win-rate to each other (save for on Consulate).
Nevertheless, comparisons showed that Villa was in fact even more attacker-sided in the nationals than APAC North and South combined; a clear change from the other three regions.
Curiously, Coastline fared much better in the Korean Open than almost any other league in the world, despite this not translating over to the APAC North and South Divisions.
Combined Stats
Below, you can see the combined map statistics of every tournament tracked by SiegeGG during Stage 2, totaling over 9,000 rounds. Note, that these equate maps played at the Six Major with those played in national leagues (such as the Benelux League and Brazil Cup).
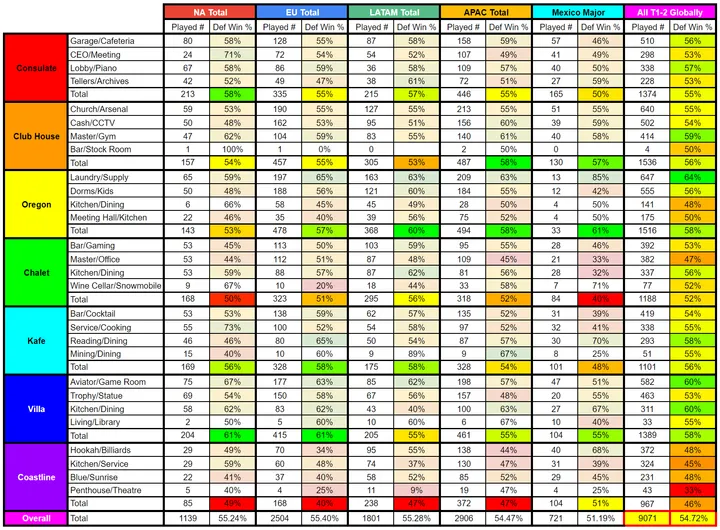
While the numbers varied region-to-region per map, the most remarkable thing here was just how close each region was by defensive win rate across all tournaments.
APAC came in at 54.47 percent, NA at 55.24 percent, LATAM at 55.28 percent, and EU at 55.40 percent. As such, less than 1 percent separated all four regions' win rates, which dropped to 0.16 percent without APAC included.

Furthermore, when comparing map-to-map, Europe and North America were within just 4 percent of each other in six out of seven maps, with Coastline being the exception. LATAM and APAC, meanwhile, were within 5 percent of each other on all seven maps.
Interestingly, these figures were nowhere as consistent in the tier-one leagues alone, but neared equilibrium with the addition of tier-two leagues.
Furthermore, with each region's tier-two scene being so close in map balance statistics, while the tier-one leagues were all mixed, it is safe to say that the patterns outlined at the top do not spread to lower-level leagues.
With Consulate leaving the map pool in favour of Bank when Stage 3 starts, SiegeGG will continue to keep track of the map stats to give a further look at how everything’s changed in three months' time.
SiegeGG is supported by its audience. When you purchase through links on our site, we may earn an affiliate commission. Learn more about how readers support SiegeGG.